
Investors Engine: Financials for Sheets™
Last updated October 7, 2026
Investors Engine: Financials for Sheets™ is the official Google Sheets™ add-on from Investors Engine. It lets Premium users retrieve supported financial statements, ratios, and valuation metrics for US stocks within a Google Sheets spreadsheet. Install it from Google Workspace Marketplace.
What you can do
The Investors Engine add-on gives you two ways to bring data into a spreadsheet:
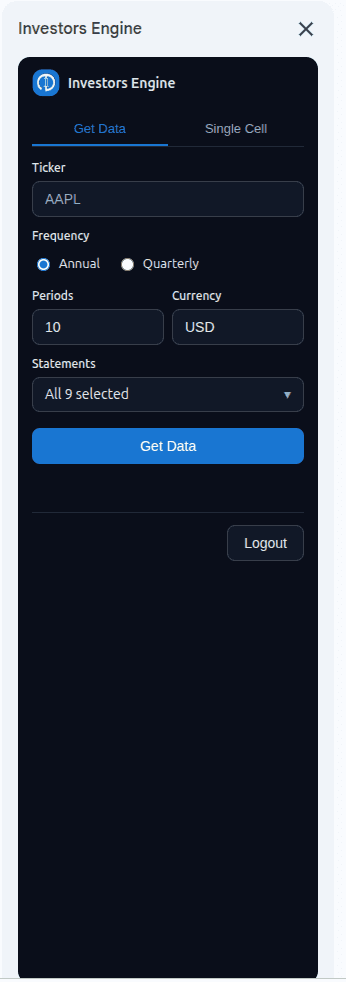
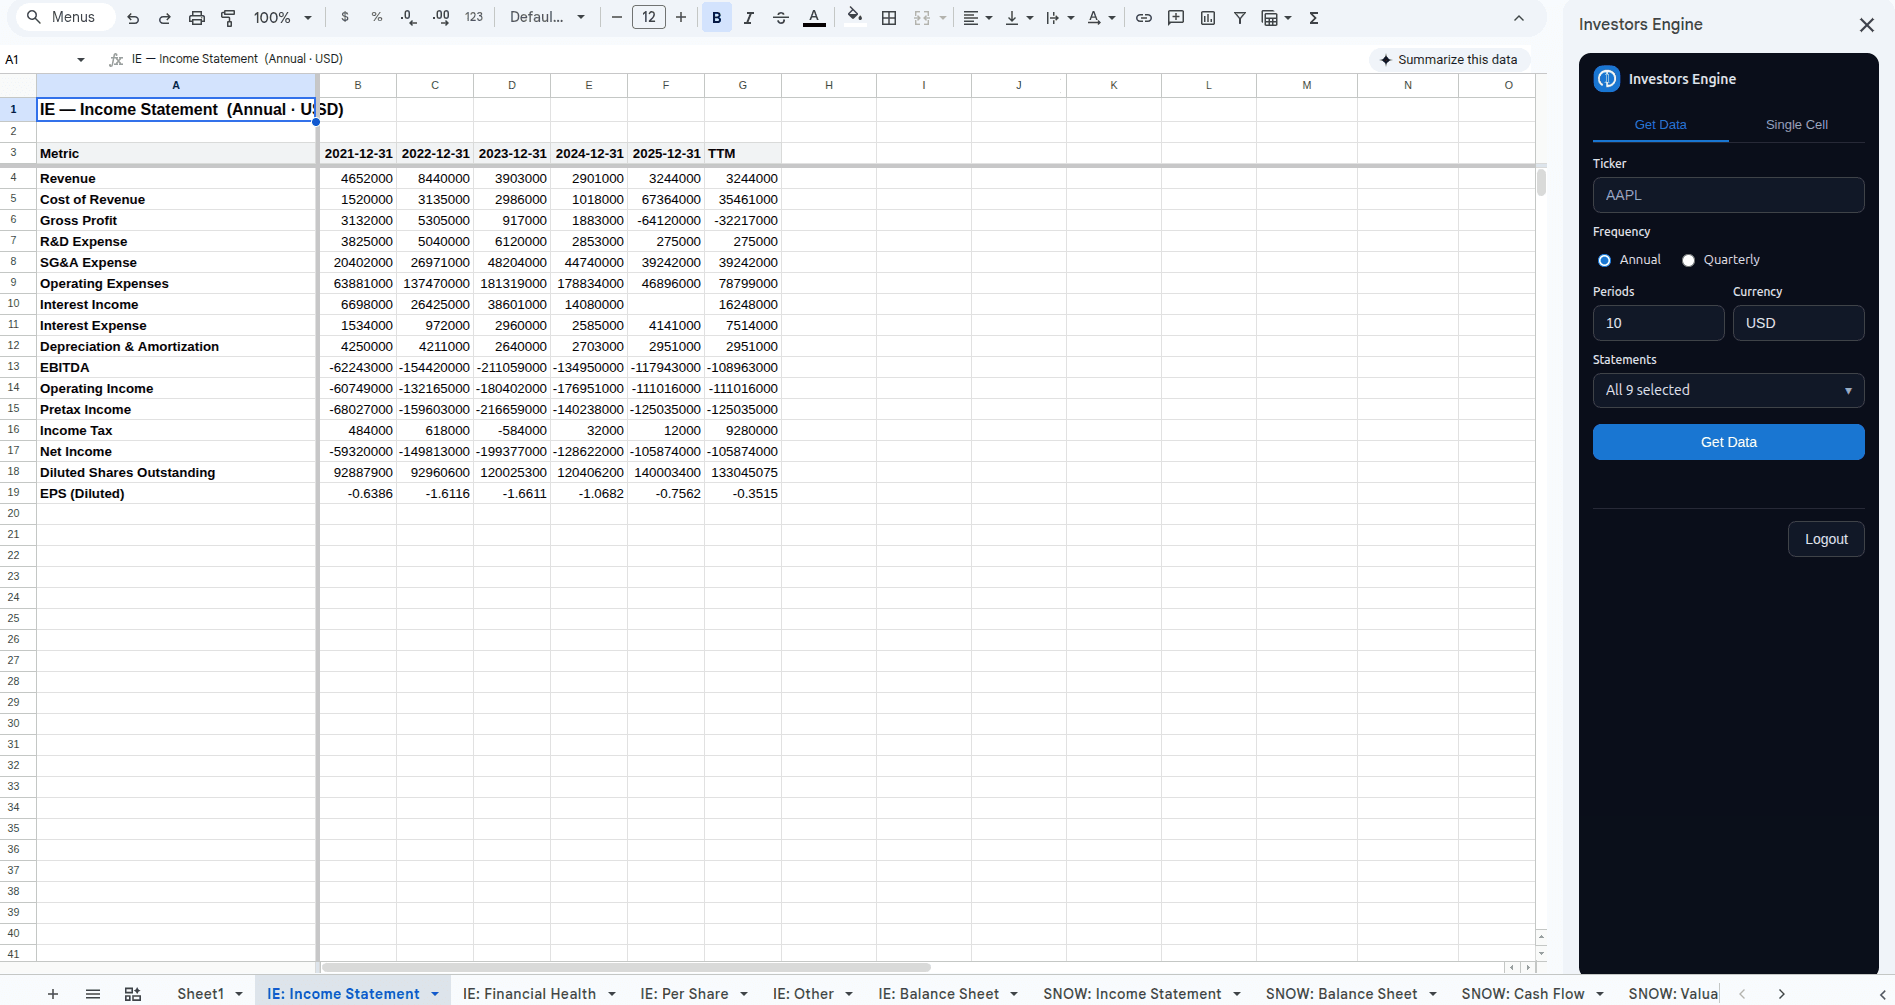
- Get Data sidebar: Enter a ticker, select annual or quarterly data, and click Get Data. The add-on creates one sheet for each selected dataset, named
<TICKER>: <Statement>(e.g.NVDA: Balance Sheet). =IE()custom function: Return a single value, a trailing-twelve-month value, or a range of annual or quarterly values. Range results expand horizontally into adjacent empty cells.- Nine datasets are available: Income Statement, Balance Sheet, Cash Flow, Valuation, Margins, Efficiency, Financial Health, Per Share, and Other.
Before you start
- An active Investors Engine Premium subscription.
- A Google account with edit access to the spreadsheet you want to use.
Install from Google Workspace Marketplace
- Open a Google Sheets spreadsheet and go to Extensions → Add-ons → Get add-ons.
- Open the Investors Engine Marketplace listing or search for “Investors Engine”, then click Install.
- Approve the requested permissions when prompted by Google.
Connect your account
- Open the add-on sidebar from Extensions → Investors Engine → Open sidebar.
- Select Connect account. Sign in to Investors Engine with Google or email and password. Your Google Sheets email does not need to match your Investors Engine email.
- Confirm the code shown in the sidebar. Return to the spreadsheet when the browser says the connection is complete.
The connection token is stored per Google account and reused across every spreadsheet in which you open the add-on. To support the =IE() custom function, the add-on also stores a copy in that spreadsheet. Logout clears the account copy and the copy in the current spreadsheet. Settings → Integrations remains the permanent place to review, revoke, reset, or manually recover a connection.
Get Data sidebar
- Enter a ticker (e.g.
AAPL). - Pick Annual or Quarterly.
- Set how many periods you want (default 10).
- Open the Statements dropdown to choose which tabs to populate. All 9 are selected by default; uncheck the ones you don’t need.
- Click Get Data.
The add-on creates one sheet for each selected dataset. Running the request again for the same ticker replaces the contents of those sheets. Running it for another ticker creates a separate set of sheets.
=IE() custom function reference
The custom function syntax is:
=IE(symbol, metric, period, frequency, currency)Examples:
=IE("AAPL", "Revenue", 2024)
=IE("MSFT", "Net Income", "2020:2024")
=IE("GOOG", "P/E", "TTM")
=IE("NVDA", "Operating Margin %", "Q3-2024", "quarterly")
A range period like "2020:2024" returns five values as an array that expands horizontally into adjacent empty cells.
Supported period formats
2024: full fiscal year"TTM": trailing twelve months"Q3-2024": a specific quarter"2020:2024": an annual range that expands across adjacent cells"Q1-2023:Q4-2024": a quarterly range that expands across adjacent cells"2024-09-28": an exact fiscal period-end date
Metric names
You can use the display name ("Revenue"), a common alias ("Sales"), or the canonical snake_case key ("net_income"). Open the Single Cell tab in the sidebar to browse the full list with an autocomplete search.
Troubleshooting
- #ERROR! Invalid Investors Engine API token
- Your connection was revoked or is no longer valid. Open the sidebar, disconnect, then select Connect account. Manual tokens remain available under Use a token instead.
- #ERROR! Premium subscription required for this symbol/metric
- The add-on requires an active Premium subscription. Upgrade your plan from the Pricing page to enable data access.
- #ERROR! Daily limit reached
- Each user has a 10,000-call daily quota, which resets at midnight UTC. To reduce calls, reference an existing result cell instead of repeating the same =IE() custom function in multiple cells.
- Data looks stale after I updated something
- The add-on can cache each ticker, dataset, and currency combination for up to 6 hours within a spreadsheet. Wait for the cached result to expire before requesting it again. Logging out does not clear this cache.
- Unknown metric
- The metric name doesn't match any display name, alias, or backend key. Open the Single Cell tab in the sidebar to see the full searchable list.
How we protect your privacy
Financials for Sheets™ requests only the Google permissions required to operate in Google Sheets and write the financial data you request to the active spreadsheet. Your other Google Drive files are not used to provide the add-on, and Investors Engine does not sell Google user data. A one-way hash of your Google account email enforces the single-account license without sending the email address itself to Investors Engine.
The add-on stores your API token for your Google account and in each connected spreadsheet so custom functions can authenticate. Spreadsheet editors with access to its Apps Script properties may be able to access that copy, so connect only to spreadsheets shared with people you trust. You can revoke the token at any time from Settings → Integrations.
Read our Privacy Policy and Terms of Service for complete details.
Contact support
Email [email protected] with the ticker, formula, and error message you’re seeing, and we’ll get back to you.